In order to start the debugging you first need to start the debugger.
click on the bug icon and accept the debugger connection settings and say ok

So once the debugger connectivity is set you can right click on the composite exposed service and can set the debug point.
Again you can have a pair of debug for request and repsonse or you can set it just for request of response. For our testing purpose lets select the pair. Once you will select the Create breakpoint pair you can now see a pair of red debug icons on the top of the exposed service marking them as accepting request and response.


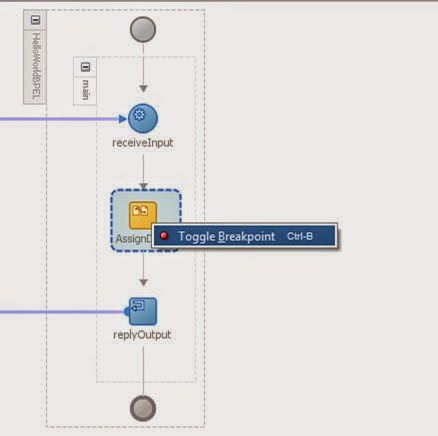
Now you can also do it at the BPEL process level also so just go inside the BPEL process.
Right click on the activity where you wanted to set the breakpoint and select it.
Now go back to your composite and again right click on the Exposed SErvices and select INitiate WS Debugging

following page will come up

Pass some default input and click on send request. As soon as you will send the request you will find that the process has started and is currently stuck at the first breakpoint.

You can go to the data tab and actually see the data that is coming to the web service.

Now to move over to the next break point just press F8 and it will automatically redirect to the next breakpoint that is our BPEL process

you can see the payload in the data tab.
Now again press F8 and you will find that it has cross the togglepoint and is actually copying the data from input to output

You can keep pressing F8 till it reaches the composite expose web service again from where you can actually see the output which the exposed service is going to receive

No comments:
Post a Comment